Waymo releases safety data across 270 million miles: an estimated 841 fewer injury crashes
After 270 million miles, a set of unadorned numbers
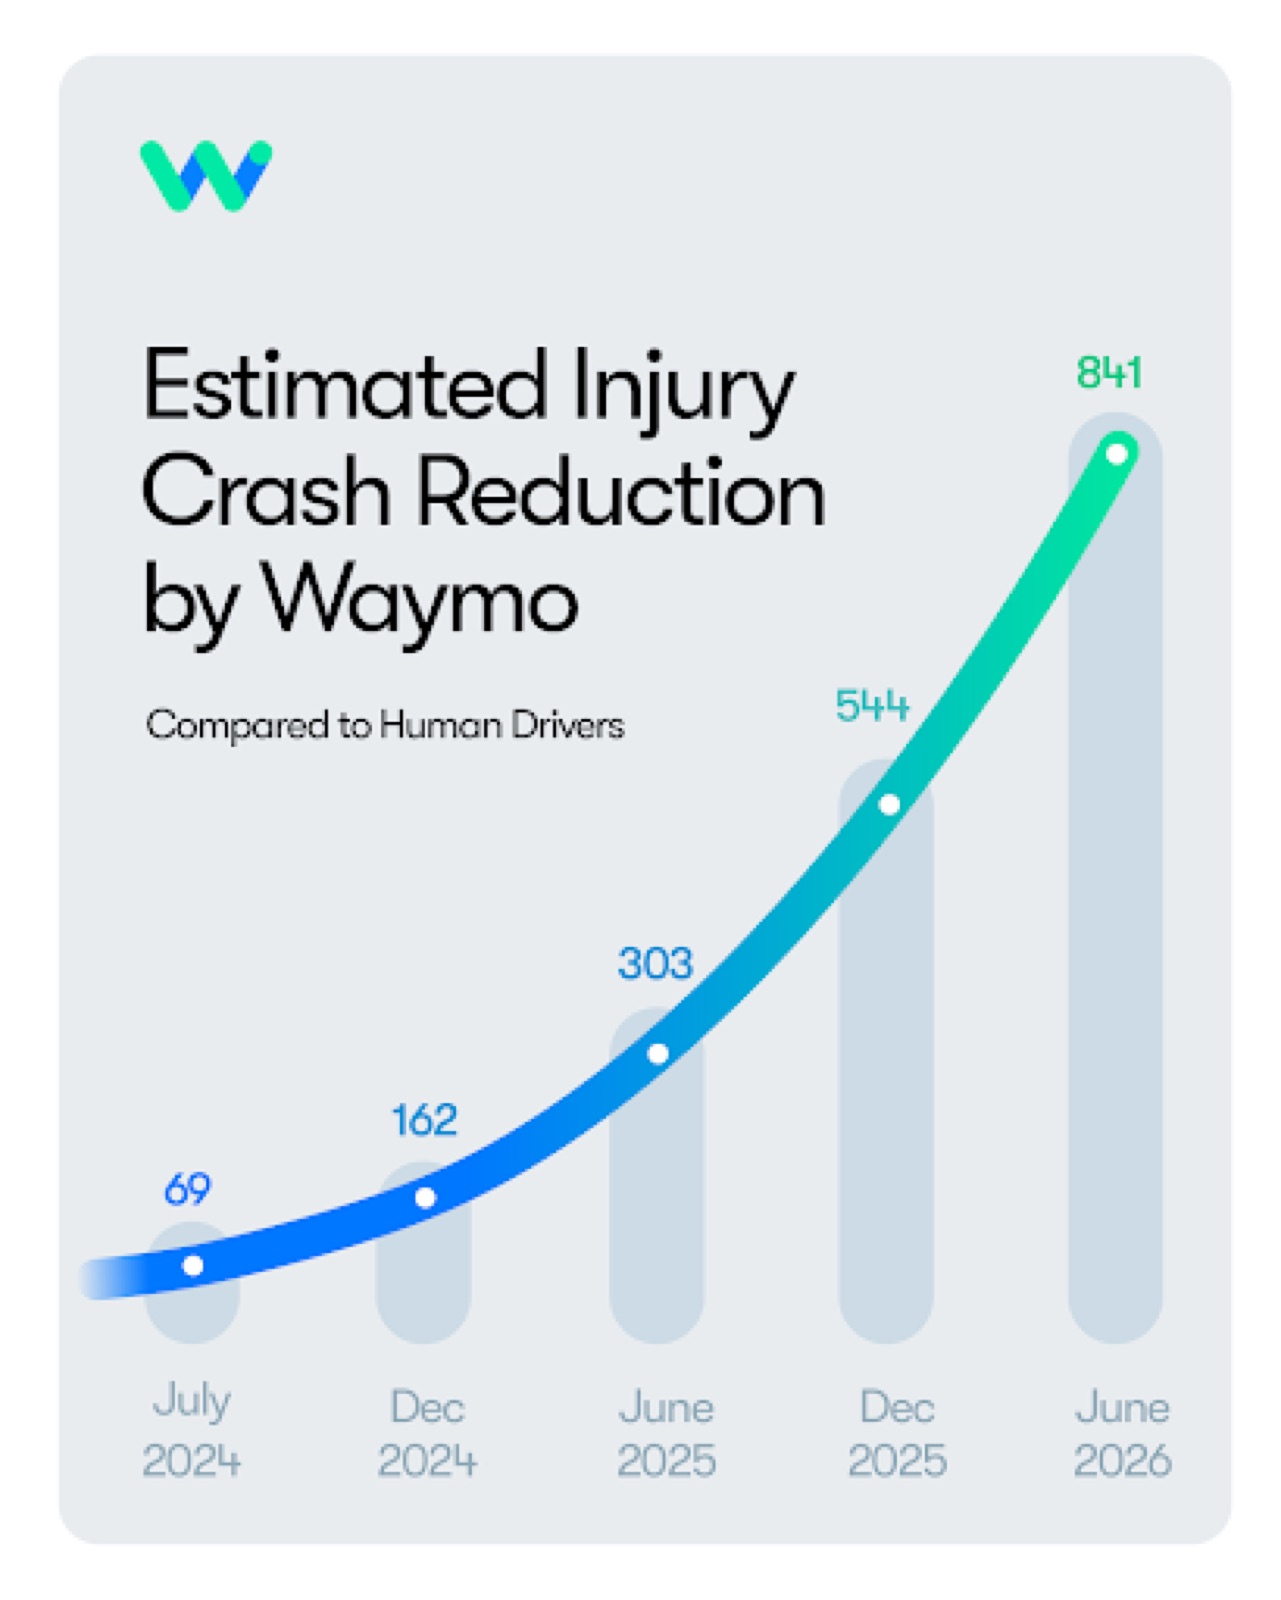
On September 24, 2026, Waymo published its latest analysis of the Waymo Driver's safety performance. The window runs through the end of June 2026 and covers more than 270 million miles of fully autonomous operations — a distance the company likens to driving the length of Route 66 more than 110,000 times. The line chart that accompanies the post is the most direct view of that data: the horizontal axis runs from July 2024 to June 2026, the vertical axis is the estimated number of injury-causing crashes avoided, and the curve is plotted at 69, 162, 303, 544 and 841 — an increase of more than an order of magnitude in two years.
The analysis spans five major metropolitan service areas: Atlanta, Austin, Los Angeles, Phoenix and San Francisco. Waymo's claim is that in these cities the Waymo Driver keeps outperforming human benchmarks, and that the positive safety impact grows as the operation scales.
The central claim is this: regardless of fault, the Waymo Driver was involved in 841 fewer injury-causing crashes than the human-driver benchmark, an 82% reduction. The phrase "regardless of fault" deserves attention — it means the count includes crashes that were not the automated system's fault, rather than cherry-picking the cases that favor the operator.
Serious crashes, pedestrians, and a much larger denominator
The gap widens for more severe collisions: crashes involving serious injury or worse fell by 95%, roughly one in twenty. These are the rarest events, but they carry the most weight in road-safety discussions — the cost of severe injury or death cannot be averaged away by total crash counts, so even a small absolute number makes the reduction a meaningful measure.
That reduction is not spread evenly. It concentrates on the least protected road users. By Waymo's numbers, injury-causing crashes involving pedestrians fell 93%, those involving cyclists fell 86%, and those involving motorcyclists fell 82%. The company explains the figures through a few scenes: driving alongside a bike lane, stepping into a crosswalk at dusk, threading a motorcycle through dense traffic — precisely the moments when road users are most exposed and human drivers are most likely to misjudge.
For the number 841, Waymo spells out its rule in a footnote: it is an estimate of injury-causing crashes prevented, assuming a conservative baseline of at least one injured person per crash. In other words, 841 counts crashes avoided, not injured people observed — and under that assumption the number of people spared injury can only be larger, never smaller. It is a deliberately conservative choice that first talks the headline down.
To read a claim like this, start with the denominator. Road safety measures risk per mile driven, not in total crashes: the more miles a company operates, the more crashes it will naturally record, and only dividing crashes by miles yields a risk level that can be compared across operators. Waymo publicizes miles rather than vehicles or rides precisely because miles are the base of the rate — which is also why the figure of 270 million miles is itself part of the claim.
The second key variable is the fault convention. An at-fault count includes only crashes the vehicles in question caused, while a regardless-of-fault count includes every crash they were involved in, and the two numbers can differ substantially: a car stopped at a red light and rear-ended is not at fault under the first convention but must be counted under the second. Both conventions are used across the industry, and a figure is nearly unreadable unless the report says which one it uses — which is why Waymo writes regardless of fault directly into its conclusion sentence.
Where the benchmark comes from: four easily skipped variables
The third variable is where the benchmark comes from. Human crash rates are not a single constant; they depend on the city, the road types, the speed distribution and the time of day. The comparison distorts if the human control group is drawn from conditions unlike the service area, or if the two fleets' miles are structured differently — highway share, nighttime share, intersection density, weather. Researchers describe this as differences in mileage composition and as crowding-out effects: autonomous operations typically start in cities, at lower speed limits and in good weather, while human miles include long stretches of highway and bad weather. The two mileages are not made of the same thing.
The fourth variable is statistical power. Injury crashes are rare events: the vast majority of miles produce none, so proving an improvement with them requires a large enough mileage denominator to narrow the confidence interval until a real effect can be told apart from random variation. That is why the scale of the mileage deserves reporting on its own: at a level like 270 million miles, this kind of data begins to carry statistical meaning, whereas comparisons over hundreds or a few million miles often remain inside the noise.
That leads to a structural problem for the industry: there is still no commonly accepted safety metric that can be compared across companies. Each operator counts its own miles, in its own service areas, under its own definition of fault, and each selects its own benchmark. As a result, published safety reports are hard to compare directly; readers can usually track one company over time but not set two companies side by side. The self-reported nature of safety data comes more from this lack of shared definitions than from any single company's preference.
Third-party auditing is therefore a long-standing ask. Regulators and researchers are pushing several concrete practices: standardized event data recording, such as requiring vehicles to retain sensor and vehicle-state data around a crash; safety self-assessment filings that companies submit for public review; and routine disclosure of edge cases and disengagement data. The shared goal is to stop safety conclusions from resting only on a company's own definitions and scripts, so that outsiders can check them against one ruler.
How to read this data
Waymo adds two checkable references at the end. The full data and methodology are published at waymo.com/safety/impact, where anyone can download them and inspect the assumptions and algorithms. And the Waymo Driver goes through a formal safety review before deployment on public roads, with the acceptance criteria used to judge readiness — "Determining the Absence of Unreasonable Risk" — set out in a published paper. Those two items at least turn "how was this computed" into a traceable, contestable question.
One more variable is extrapolation. A number like 841 is an estimate: it is derived by combining observed crash counts with a benchmark rate, so its reliability depends entirely on whether the benchmark assumptions hold. Any statement of the form "X fewer crashes" should therefore spell out which dataset supplied the baseline, what the time window and geographic scope were, which fault convention applies, and whether a confidence interval is given. Without the assumptions, the number is a promotional quantity rather than a comparable finding.
So the more restrained reading is this: it is a safety analysis produced under Waymo's own definitions, not an independently reproduced benchmark — the control group, the service areas and the statistical method were all chosen by the company, and readers have no third-party recomputation to compare against. At the same time it should not be dismissed as marketing. The mileage is real: 270 million fully autonomous miles across five metropolitan service areas is a sample large enough that the differences it shows are no longer just random noise. For a reader, treating it as a traceable, arguable, but genuinely relevant data point comes closer to the facts than treating it either as settled truth or as pure public relations.